Integrating R with Power BI
Microsoft Power BI Desktop version nicely integrates with R. R is an open source software for statistical computing and graphics. R has become popular among the data scientists because of its powerful data analytics and visualization capabilities. Power BI is Microsoft’s flagship BI tool for creating dashboards and interactive reports. With R as a backend engine for Power BI Desktop, you can do many cool things, which can be categorized into three broad applications–
- using R to import data into Power BI,
- using R to query existing data in Power BI, and
- creating visuals with R script
In this article, I have demonstrated how to use R with Power BI to perform these applications.
Application 1: Using R to import data sets into Power BI
Power BI can import data from a variety of sources. For a complete list, please see here.
Importing Excel .xlsx or .csv files into Power BI is perhaps the most common usage. However, I’ve personally found it to be problematic. In particular, if your source data is continuously updating including addition or removal of columns, then the changes do not get updated when you simply refresh the data sources from Power BI Desktop. This is a problematic when you are developing your interactive report and also when the dashboard is in production.
A more robust solution of importing data is to use R script. This is known as Running R scripts in Power BI Desktop.
Preparing the R script in R Studio
This is the stage you would write your R script to load your data. I use R studio for that. RStudio is a popular Integrated Development Environment (IDE) for R. If you are not familiar with RStudio, you can use the default R editor or wherever you write your R codes. You do not need any special preparation. Just use the editor to test your code before using in Power BI.
I am going to create a smiple data set with two columns using the R codes below. This data is being created for demonstration purposes only so that you can reproduce it when you are learning.
# Sample data frame object

df <- data.frame(
  x= rnorm(100),
  y= rnorm(100) + rnorm(100)
)

head(df)
This code creates an R data.frame and saves in an object df. This will be the name of the data when you import into Power BI. You can give the data object any valid R-name you want.
The above code also shows head(df), but Power BI only imports data.frame. In this case, it will only import the df object and ignore the rest. So you don’t have to worry about other codes in the script. Just make sure all codes run without error and without any dependencies.
Run your R script and import data
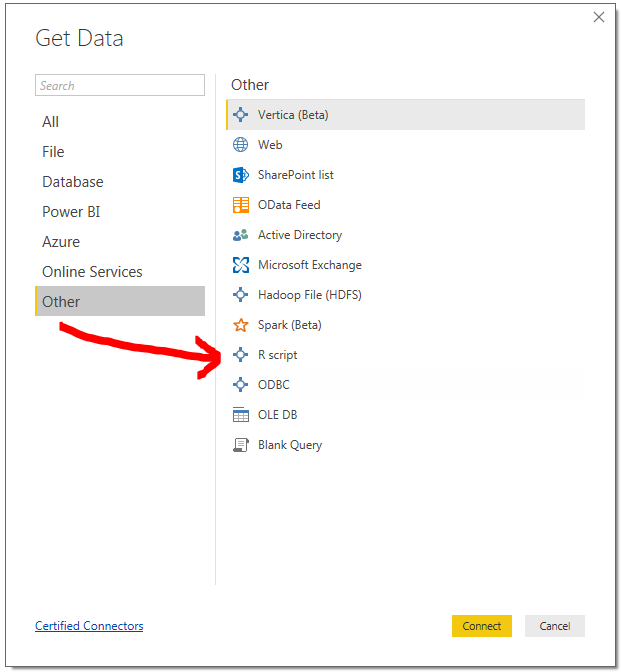
In Power BI Desktop, the R Script data connector is found in Get Data menu. Click on Get Data > More…, then select Other > R script as shown in the following image:
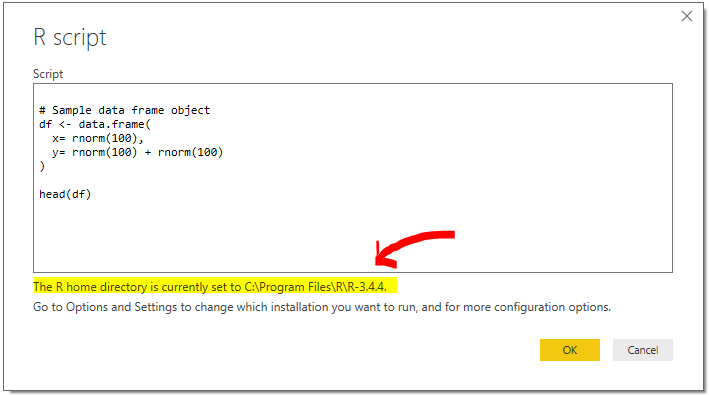 Notice that at the bottom of the above image, the your R installation path is displayed. If you have multiple installation of R, then you would need to go to Options and Settings > Options > R scripting and then setting the location of the R installation you would like to use.
Error message
After you enter the R script and hit OK, you might see a connection error message as follows:
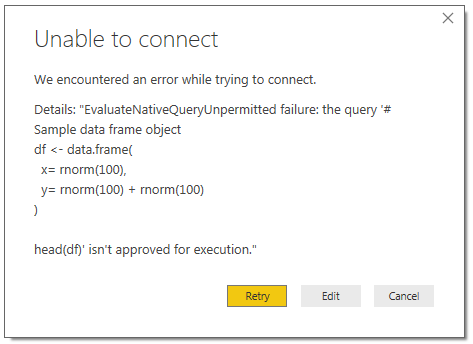 In that case, you need to click on Retry and that will take to you the following message to enable native database query. Click on Run. If you want to know more about risk involved with this option please see the official documentation
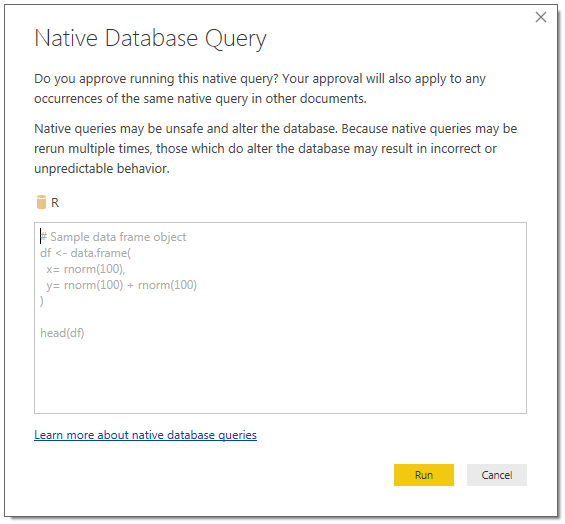 After that, it should run without any issue and you should see a window like the following:
Loading the data
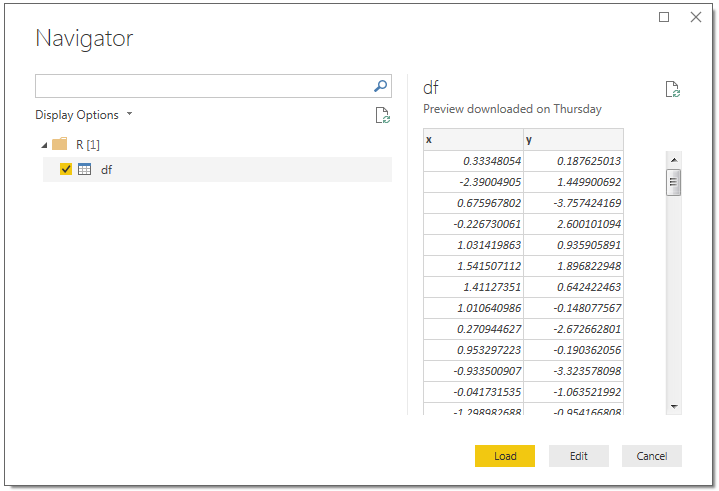
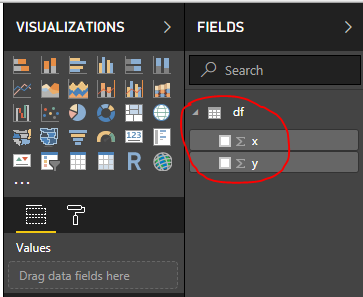
Once you are at this stage, you select the data frame created with the R script (in this case df), and then click Load (or Edit if you want). This should load the data in Power BI. You can verify that in the Fields pane that the df has indeeded loaded as shown in the folowing:
 Now that you’ve successfully imported the data using R script, you can use the variables the typical way you would work within Power BI Desktop. If you want to add or edit any new column/variables or anything with the data using the R script, you would need to update the R script and load the data as usual.
When you edit the R script, you should not see any error/warning messages because you’ve already made those exceptions.
Updating the R script
It is obvious that you would be updating the R script since that was the whole purpose of importing the data via R script. You continue to edit the script in RStudio and when you are ready to update the code within Power BI, you need to go to Edit Queries option.
Simply right-click on the data under the FIELDS pane, and select Edit query. This should open the Power Query Editor and you can click on the gear icon ([1] in figure) as shown below:
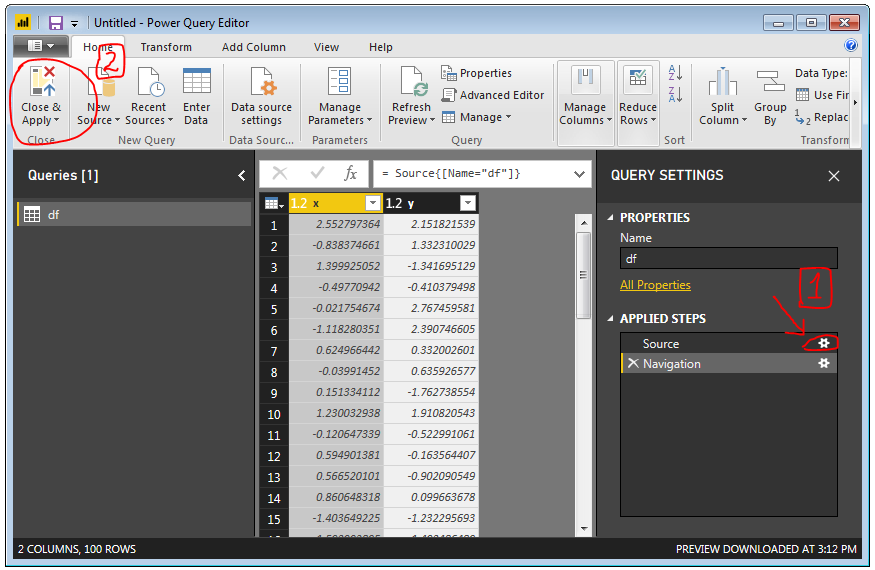 Clicking that gear icon should open the R script editor where you can replace the existing code with the updated code. When you are ready, click OK, and then click Close & Apply ([2] in the figure) in the Power Query Editor to apply the changes.
Application 2: Using R to query existing data in Power BI
This application is useful for manipulating an already imported dataset. That is, data have been imported into Power BI Desktop, and now you want to do some cleaning or perform transformations. Essentially, you could do all of those while importing the data (Application 1). Interested readers may find the detailed document available from Microsoft Power BI on using R in Query Editor. I am giving an example to demonstrate how it works.
Example to demonstrate re-coding
Suppose we’ve imported a data set with missing vlaues and unusually large numbers in some of the fields. We want to perform some cleaning. Of course this is a fictitious example just to demonstrate the idea.
We use the R code to generate the data
df <- data.frame(
  name = c("John", "Arif","Samira"),
  sex = c(1, 1, 2),
  gpa = c(4, 3.9, 3.95)
)
We will import this data using the R (discussed in Application 1). Once loaded, we will then do some transformations. To keep it simple, we will just recode the sex variable to indicate Male for 1 and Female for 2. For that, we use the following codes which we would enter in the R script:
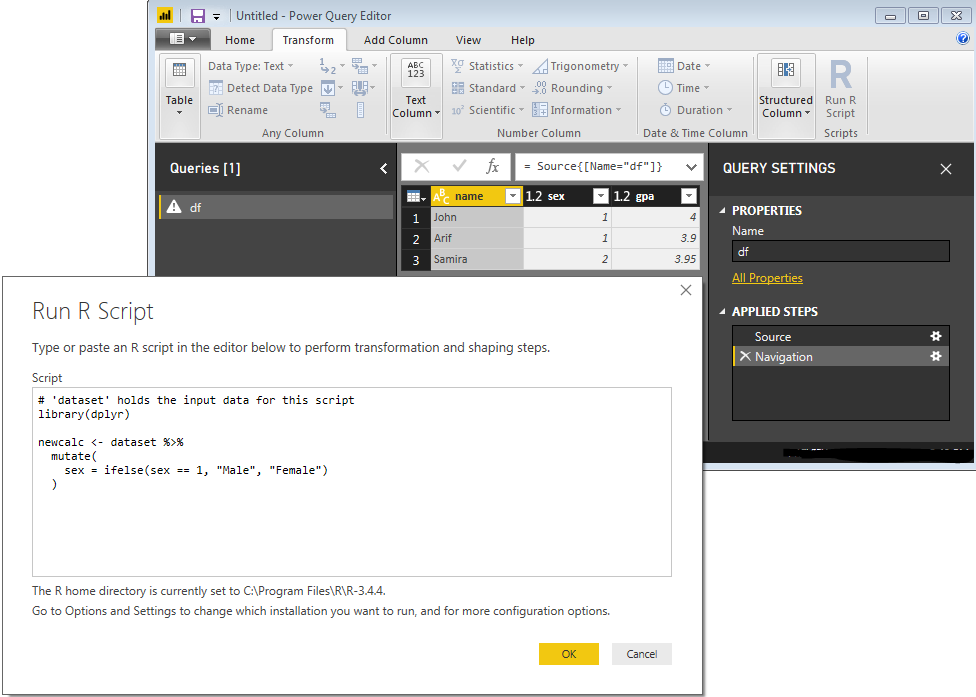
# 'dataset' holds the input data for this script
library(dplyr)

newcalc <- dataset %>%
  mutate(
    sex = ifelse(sex == 1, "Male", "Female")
  )
Entering R script to transform data
- Click on the Edit Queries button in Power BI Desktop to open the query editor.
- Select the appropriate query under the
Queries[]menu on the left of the screen. - Click on the Transform menu above the ribbon.
- You will see the Run R Script button with the
Ricon. Click that.
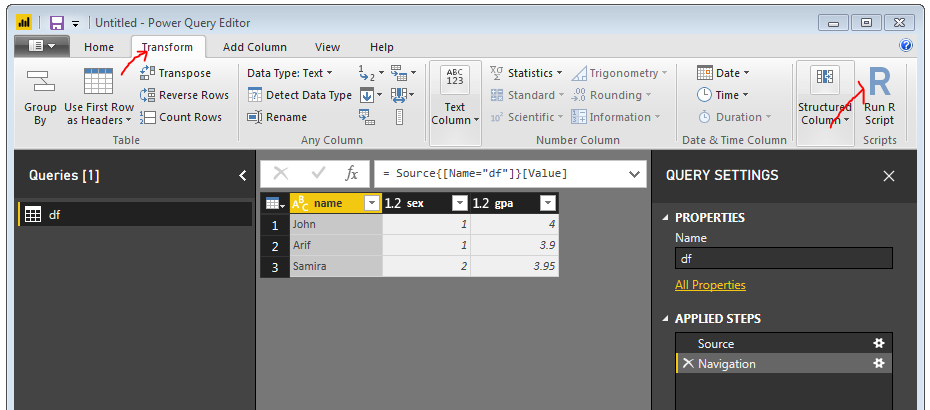
Enter the R code that will be used to do the transformation. The screen would look like the following:
Click OK. If you see any permission error or message like that, follow the prompts and allow the R codes to execute. Once you successfully pass all the prompts (if any), you will get the screen that looks like this–
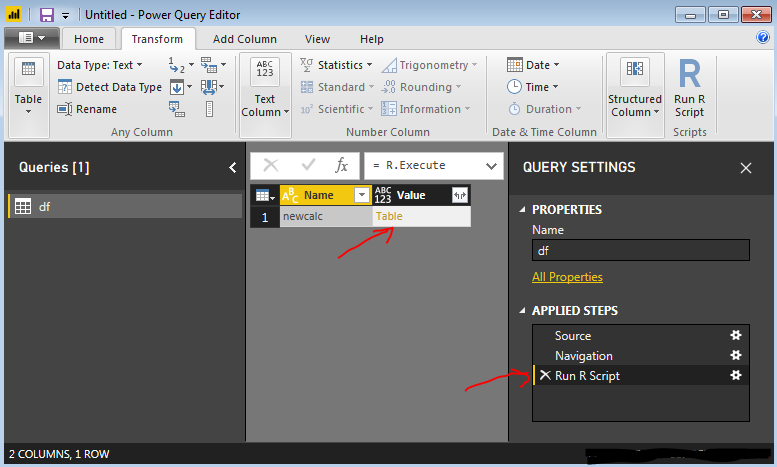
Make sure to click on the Table field shown with the arrow in the figure. That will create the new step named newcalc and the table as shown in figure below.
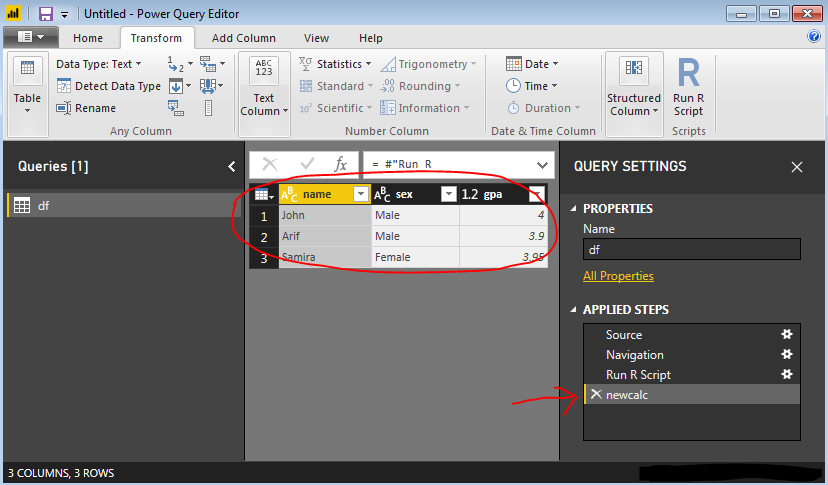
Now you click on the Home menu and hit the icon that says Close & Apply as shown in the figure below.
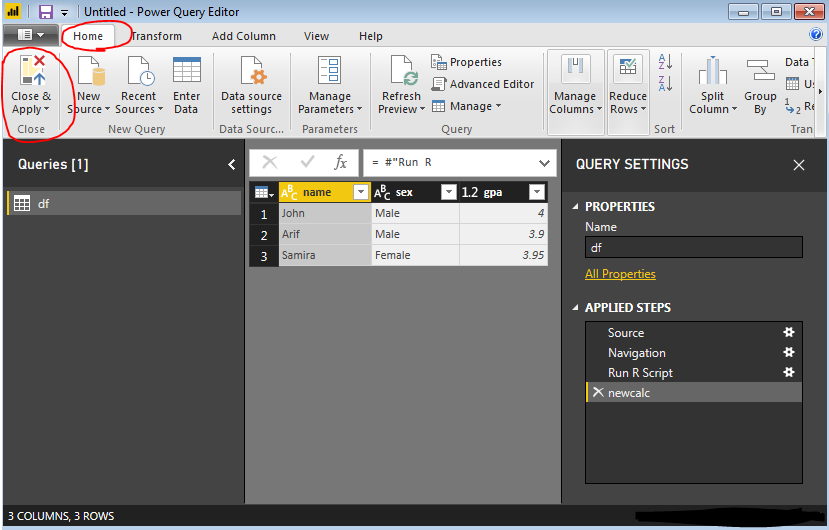
Now the sex variable in the table should be a character variable with values Male and Female instead of 1s and 2s.
And you are done!
Application 3: Creating visuals with R script
One of the best applications of R with Power BI is that you can harness the power of R to create high quality graphs and display them within your report/dashboard in Power BI. All the filters/slicers will work as usual and the graphs will the dynamically updated when you slice your data.
You can bring R visual into Power BI in two ways–
- Importing an R visual from Microsoft AppSource
- You can wirte you own code to create the visuals.
In this article, I’ve demonstrated how to use your own code to create visuals with R and display them in Power BI.
Example with mtcars data
This assumes that we already have a dataset in Power BI. For the sake of reproducibility of this example, I will create the data. This time, I will just load a car data set called mtcars available within R.
Simply follow the steps in Application 1, using the code entered in the R script window:
df <- mtcarsThis loads the data in Power BI as shown in the figure below.
Now, we would like to create a boxplot of gas mileage (miles per gallon) by cylinder type. We call the
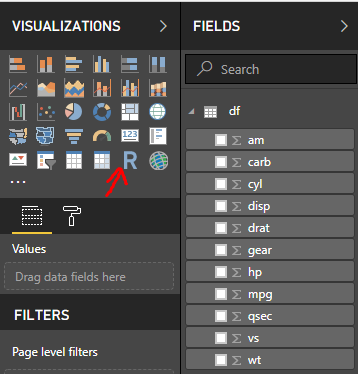
To creat a R visual, click on the R icon from VISUALIZATIONS pane as seen in the above image (the icon is pointed with a red arrow).This should create a placeholder for a visual in the canvas and an R script editor will show up at the bottom of the screen.
Select the variables you want to use for the visual. In our case, we would need cyl and mpg. Once you select them, the R script editor will update with some basic codes (uneditable).
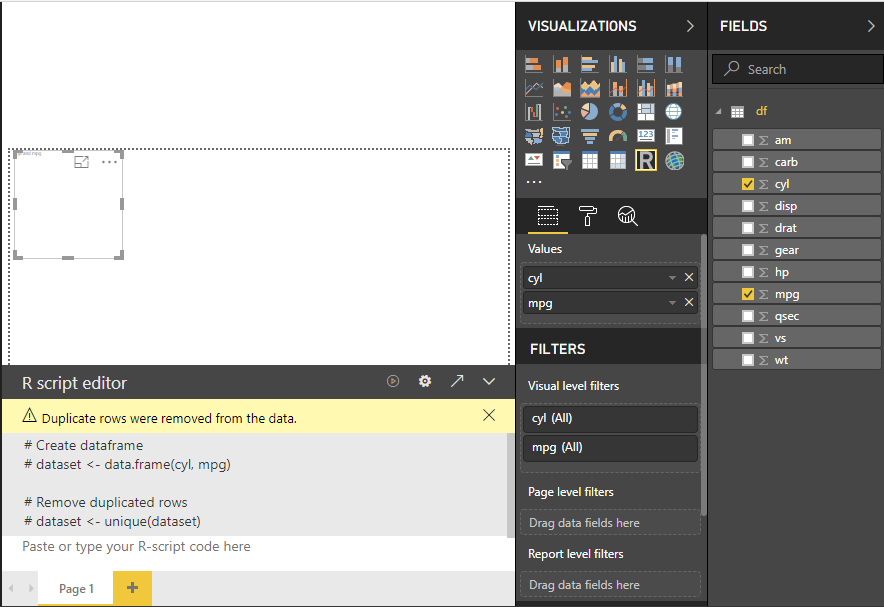
Now you are ready to enter the following code in the area where it says “Type or paste your R-script code here”. Enter the code below:
boxplot(mpg ~ cyl, data = dataset,
        xlab = "Number of Cylinders",
        ylab = "Miles Per Gallon",
        main = "Gas Mileage",
        notch = FALSE,
        varwidth = TRUE,
        col = c("blue","green","red"),
        names = c("High","Medium","Low")
)
Then click on the little play button near the top of the script-editor to display the plot on canvas.
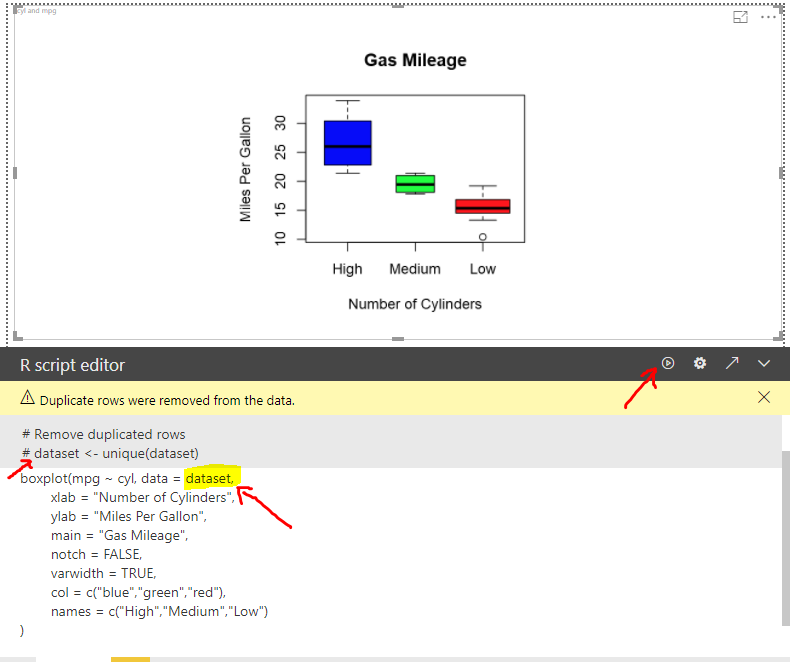
And it’s that easy.
Hope this tutorial was useful for you. If you have any question or have some tips, please leave them as a comment.
I appreciate if you share this via social media. Thank you for reading.